Migration patterns in Myanmar: a network analysis of census data
By Zaw Myo Tun in Data analysis
June 1, 2021
The latest Myanmar population and household census was conducted in March 2014 by the Ministry of Immigration and Population. It was the first national census since 1983. The aim was to count every person in the country on 29 March 2014 (census night) and to collect demographic, social, and economic data.
In this analysis, I looked at migration between states and regions. Myanmar is administratively divided into 7 states, 7 regions, one union territory, 5 self-administered zones, and one self-administered division. Data were available for states, regions, and the union territory.
I used data from a table of aggregated numbers in which the state/region of usual residence was tabulated against previous residence or place of birth, segregated by sex. In addition, people were also asked the main reasons for migrating. These data were collected using a household questionnaire from almost 11 million conventional households. The data table (xlsx, 52 KB) is available on the Ministry of Immigration and Population website. The main census report (pdf, 16 MB) can be downloaded here.
Network analysis
Migration was inferred if the previous residence or birth place (state/region) reported by a person is different from his or her usual residence. I constructed networks based on the migration data using nodes and directed edges. Nodes represent the state/region while edges represent migration with the direction of the arrow pointing to the destination state/region. Edges are weighted by the number of migrants.
Two networks were constructed: one for migrating from previous residence to usual residence, and another from birth place to usual residence. The former may be interpreted as recent migration patterns while the latter can be thought of as cumulative trend over longer time period although each interpretation has limitations.
Both networks were completely connected as population movements happened across all states/regions. To understand how connected the nodes are, I ranked them based on their reported population influx and outflow. In addition, I calculated migratory flux for each state/region, defined as the number of population inflow divided by outflow; a value of one means that the volume of migrant inflow and outflow are balanced. A value smaller than one means that there were more people moving out than moving in and vice versa if the value is greater than one.
Below are network representations in which I used circles and arrows to represent nodes and edges, respectively. The node size corresponds to their migratory flux values. The node colour represents the group the node belongs to based on a grouping algorithm (See below for more details). The edge width represents the volume of migrants and their colours are the same as the nodes they emerge from. For clarity, colours were added only to the edges that represents 50,000 or more migrants. All other edges were gray-ed.
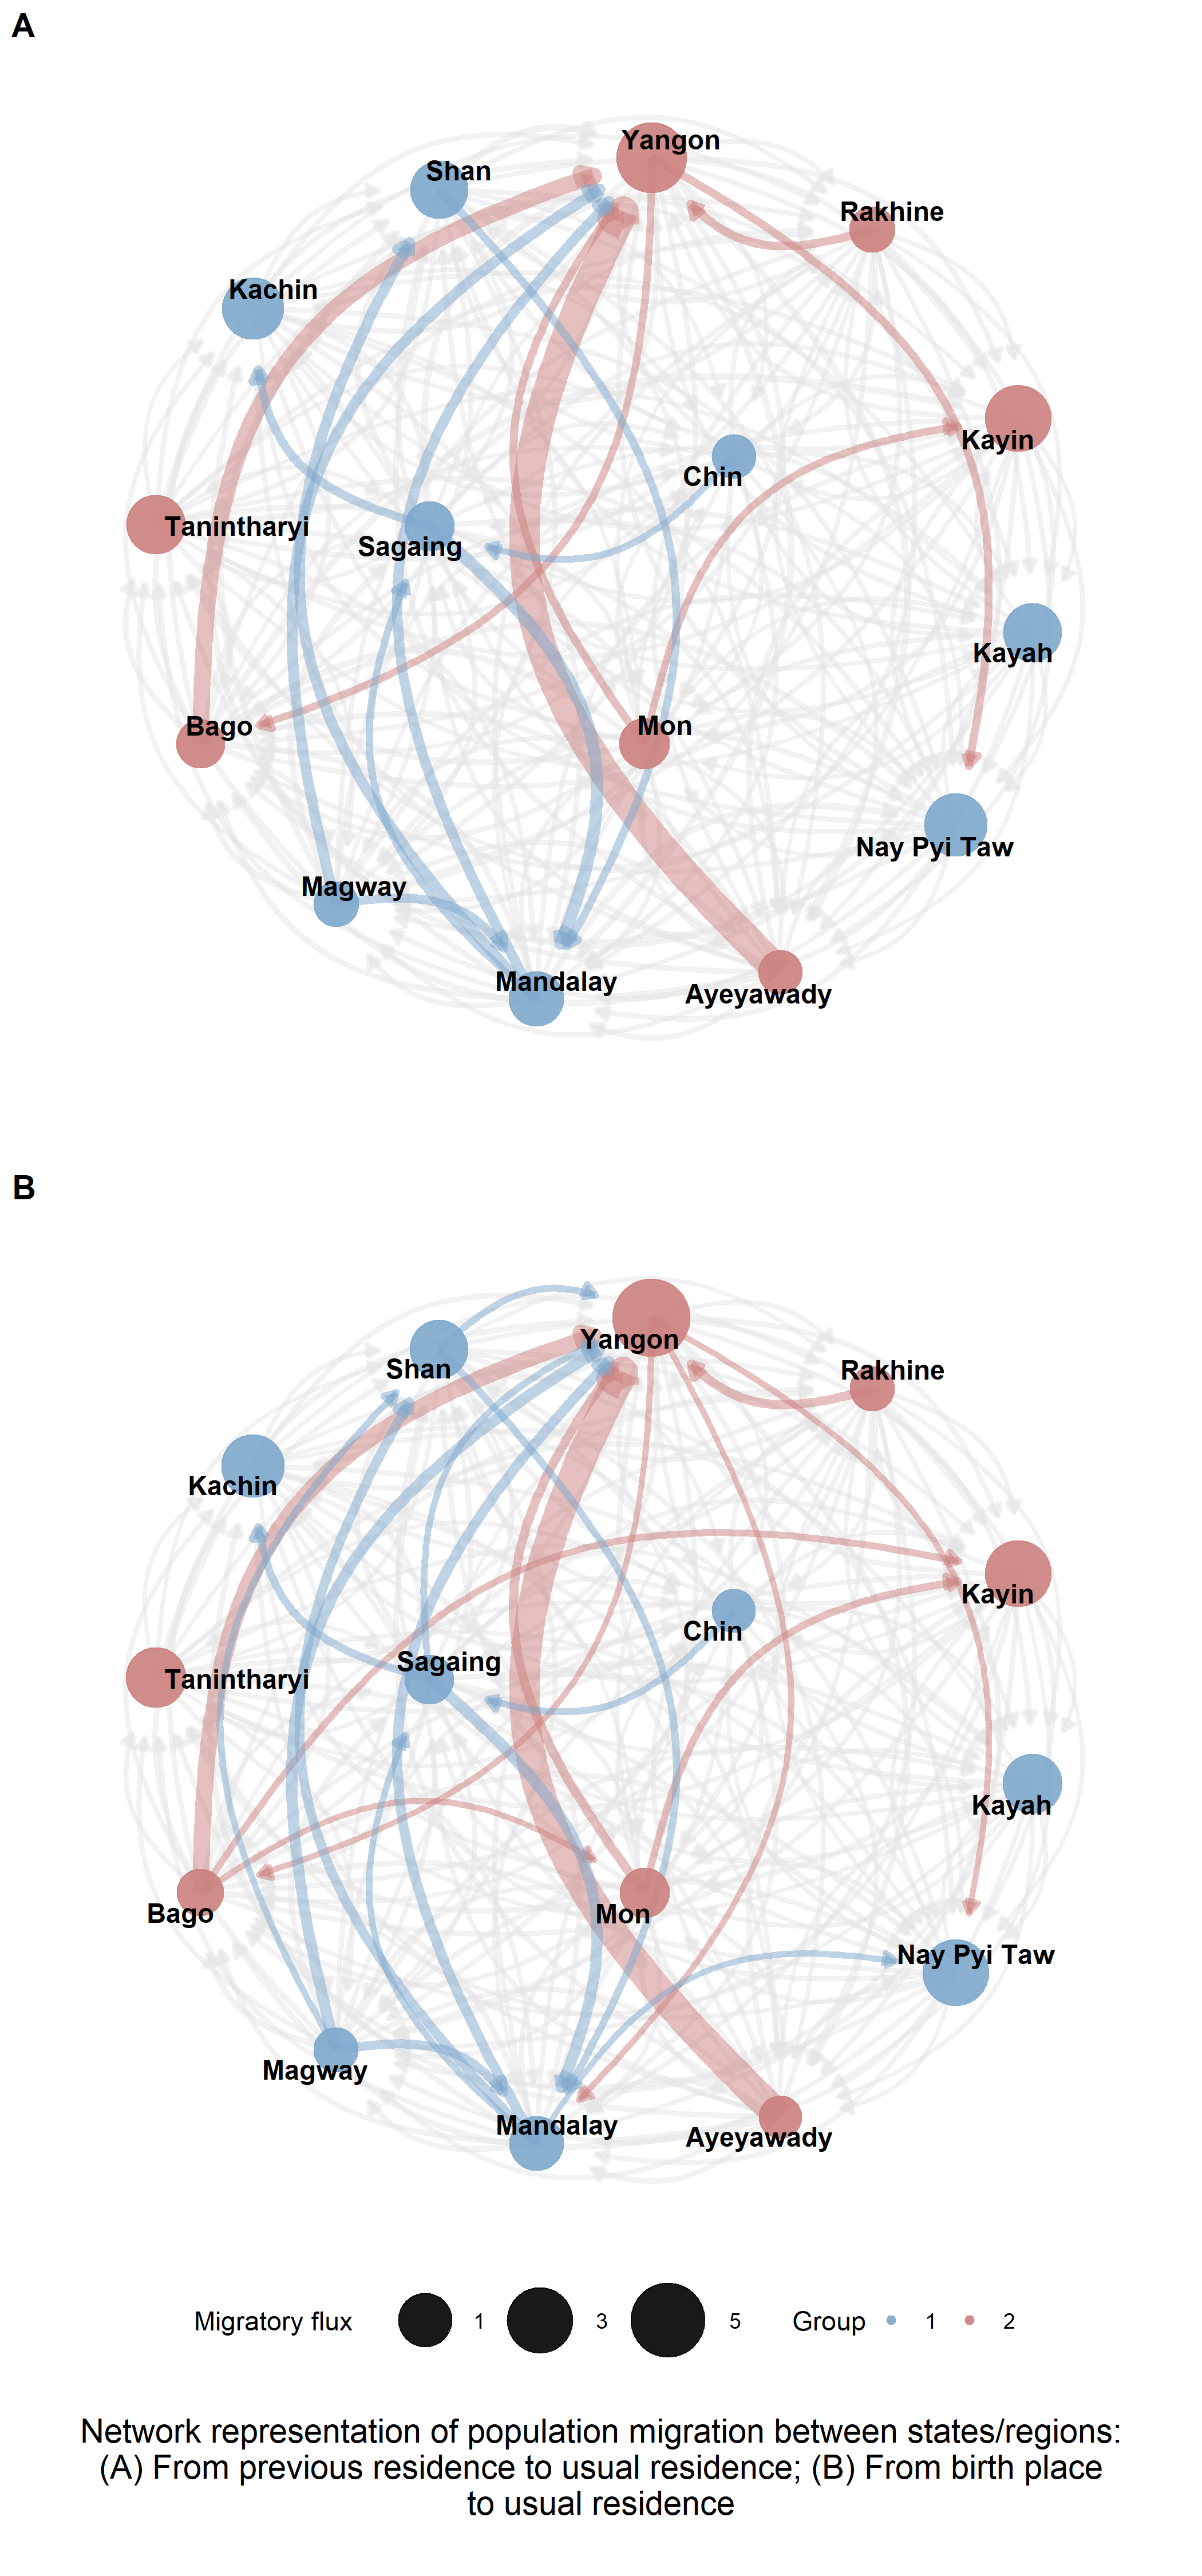
Migration patterns of both networks were very similar with almost identical main features. In both networks, Yangon received the highest volume of migrants from many states and region with most migrants moved from Ayeyawady and Bago regions. Top three states/regions with the highest influx of migrants were Yangon, Mandalay, and Shan while the top three with the highest outflow were Ayeyawady, Bago, and Mandalay. Migratory flux is highest in Yangon, Kayin, and Nay Pyi Taw and lowest in Ayeyawady, Chin, and Magway.
The migration patterns within each network were diverse. Yangon is the most populated region in the country and is where the commercial capital is located. With the highest migratory flux value, recent migration patterns show that Yangon Region has received migrants almost four times as many as its population outflow. Mandalay Region has one of the highest in both population inflow and outflow. With a migratory flux of approximately one, Mandalay Region has a very high population turnover. I observed similar migration patterns between men and women when the data were analysed separately (results not shown).
The table below shows the number of migrants moving in and out of each state/region, sorted by the migratory flux.
From previous residence to usual residence From birth place to usual residence State/region Population influx Population outflow Migratory flux Population influx Population outflow Migratory flux Yangon 1,391,057 351,797 3.95 2,048,643 349,059 5.87 Kayin 168,676 54,527 3.09 200,007 64,459 3.10 Nay Pyi Taw 193,500 81,339 2.38 225,752 74,312 3.04 Kachin 205,371 94,204 2.18 237,262 100,239 2.37 Tanintharyi 86,879 51,435 1.69 110,644 60,177 1.84 Kayah 32,732 20,832 1.57 38,687 21,889 1.77 Shan 331,822 216,617 1.53 398,749 244,687 1.63 Mandalay 499,655 457,930 1.09 604,415 577,846 1.05 Mon 127,749 198,358 0.64 164,539 284,599 0.58 Sagaing 211,019 360,813 0.58 235,213 454,463 0.52 Bago 228,112 493,340 0.46 240,075 680,370 0.35 Rakhine 35,161 140,187 0.25 39,890 200,776 0.20 Magway 94,788 417,252 0.23 104,280 564,060 0.18 Ayeyawady 116,603 720,431 0.16 126,341 1,018,461 0.12 Chin 11,827 75,889 0.16 12,666 91,766 0.14 1Overall number of migrants moving in divided by those moving out of a state/region
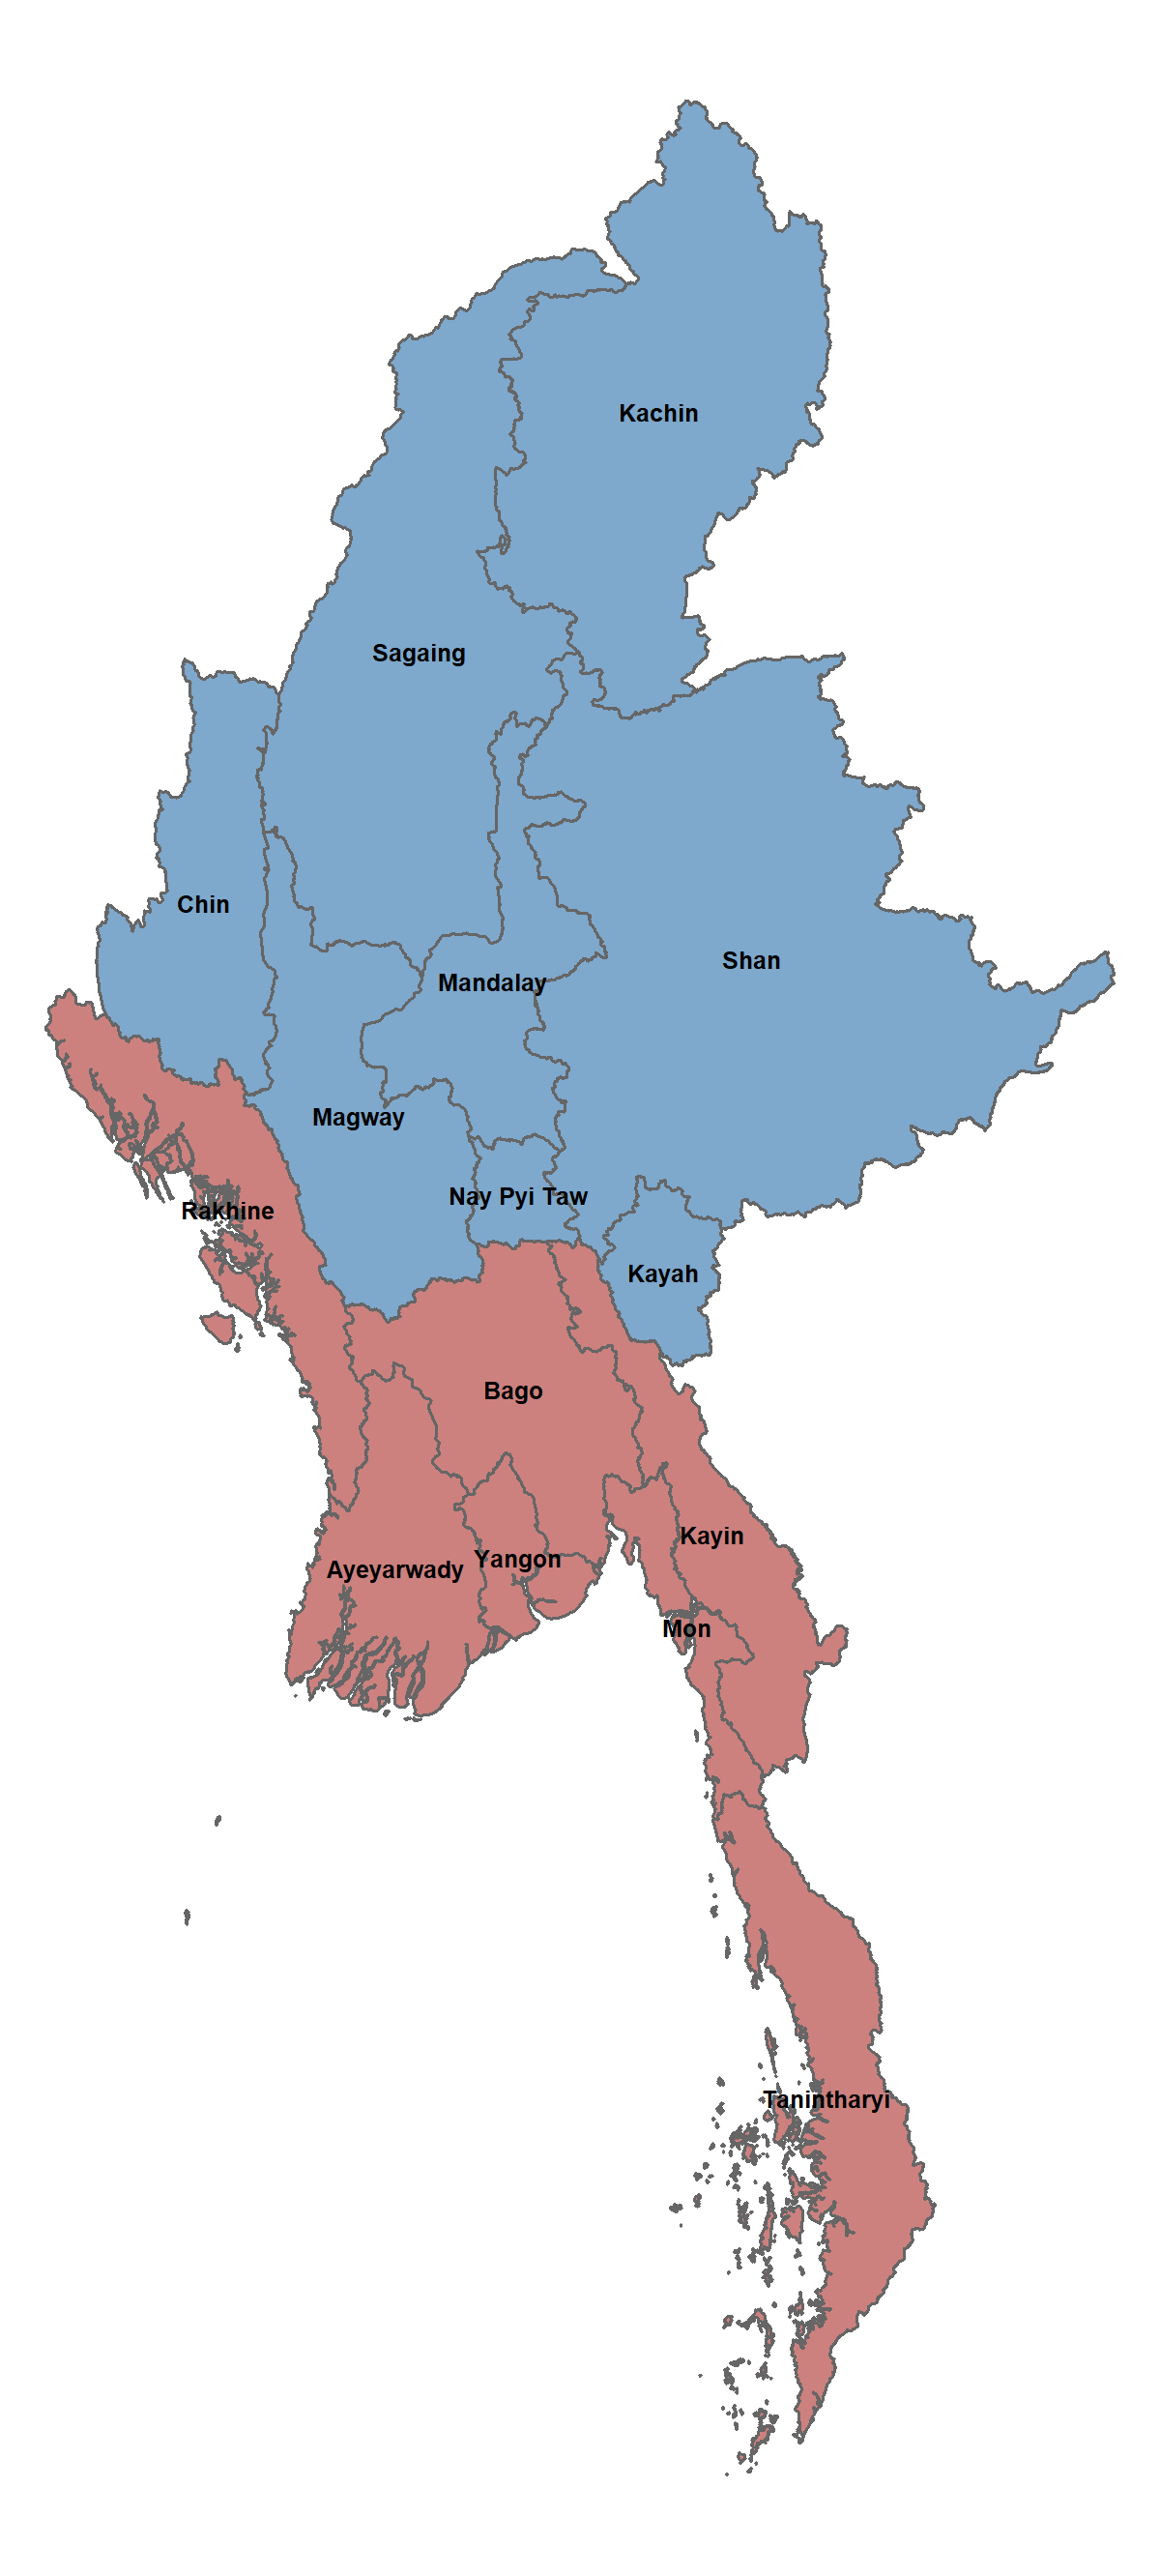
Data-driven grouping of the states and regions
I used a data-driven technique called hierarchical clustering and grouped the states and regions. It is an iterative process in which highly connected nodes are merged together using fast-greedy algorithm. Through this process, the group membership is determined by maximising the node connectedness within the group while minimising the connectedness between the groups.
Two groups of states/regions emerged from this analysis. Interestingly, the states/regions in each group were geographically proximal to each together with one group located in the south around the coastal region and the other located in-land in the north.
This grouping pattern is robust and consistent in both networks, in overall analysis and in subgroup analysis by sex (results not shown).
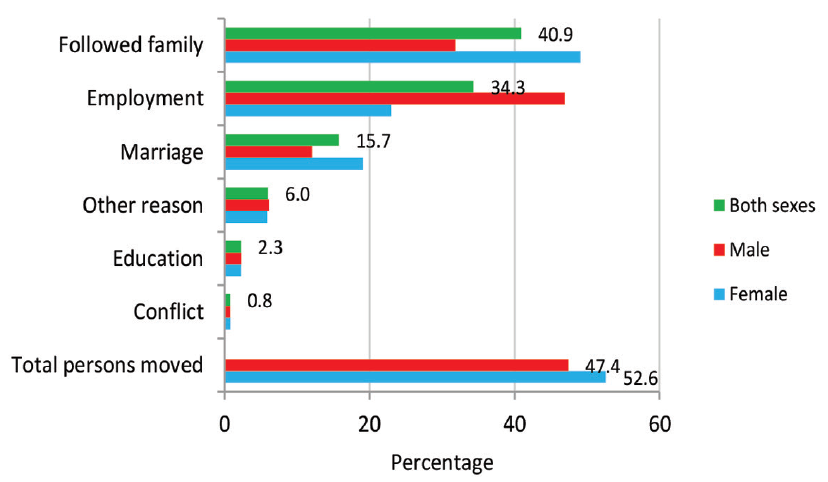
According to the main census report, most people appear to move for economic reasons; 41% of migrants (majority were women) cited following families and 34% (mostly men) cited employment as the main reasons (See the plot below). Therefore, the two distinct migration patterns may suggest distinct ways of organising the economy. More data are necessary to look at this further.
Caveats
We need to have some caveats in mind while interpreting the data. These data do not include population in “institutional household”: for example, old-people’s homes, orphanages, hospitals, boarding schools, hotels, hostels and guest houses, institutions for persons with disabilities, prisons, monasteries, convents, military and police barracks, and camps for workers.
Another caveat is the lack of information on the timeframe of migration. Without this information, it is difficult to interpret the recency of these patterns and how they change over time.
- Posted on:
- June 1, 2021
- Length:
- 7 minute read, 1426 words
- Categories:
- Data analysis
- Tags:
- Myanmar census R network analysis
- See Also: